FarCry 7.2.9: server memory issues in shared hosting environment

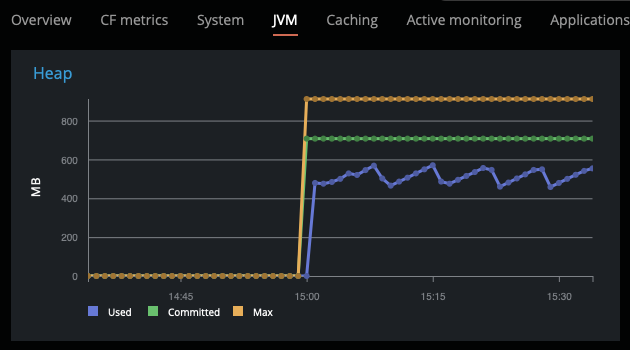
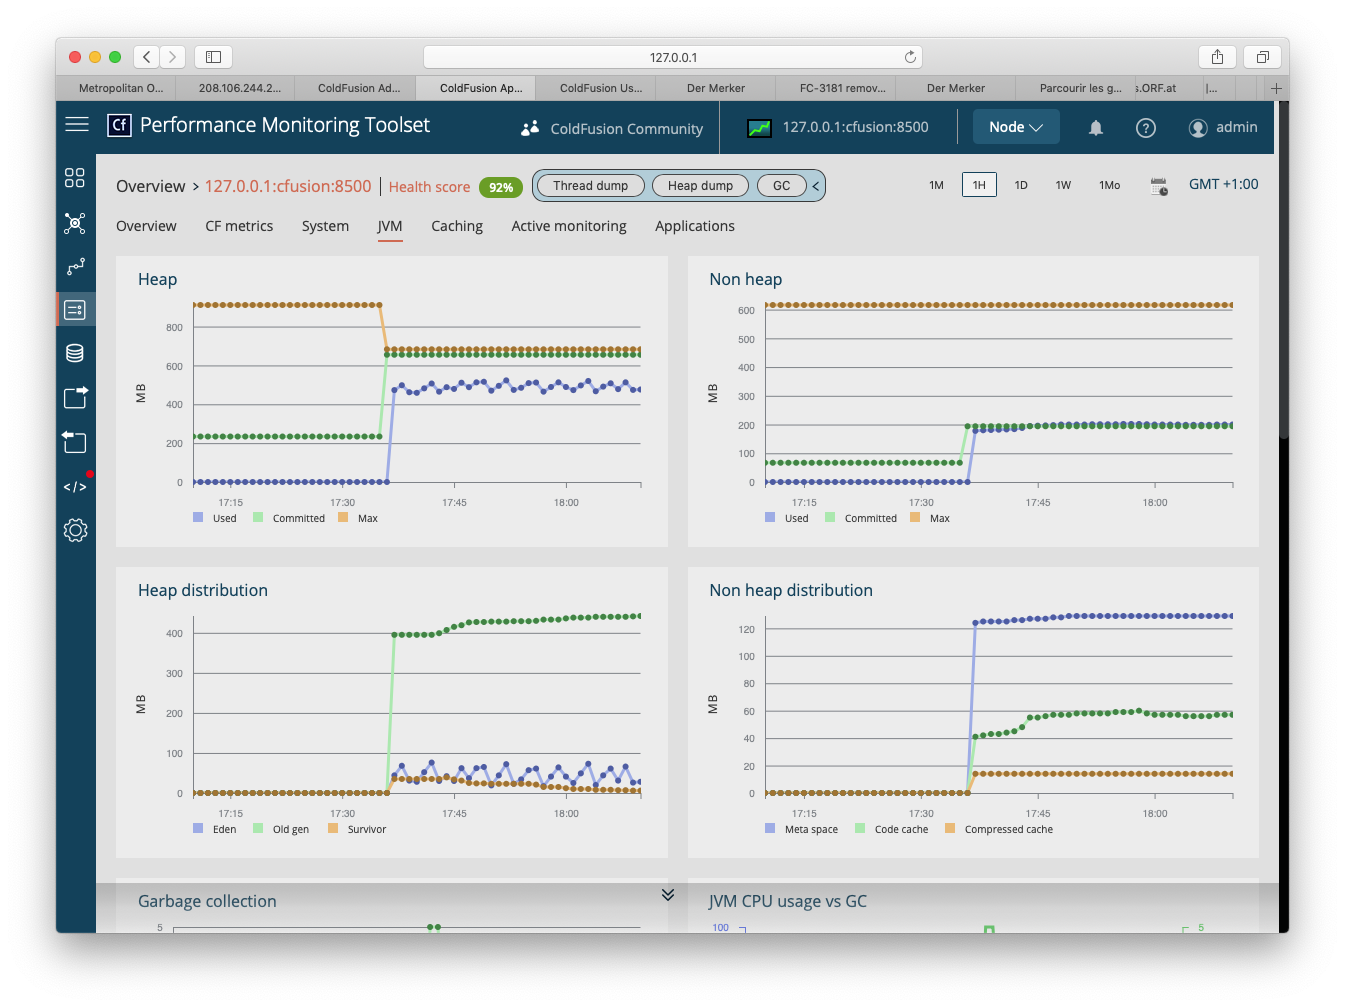
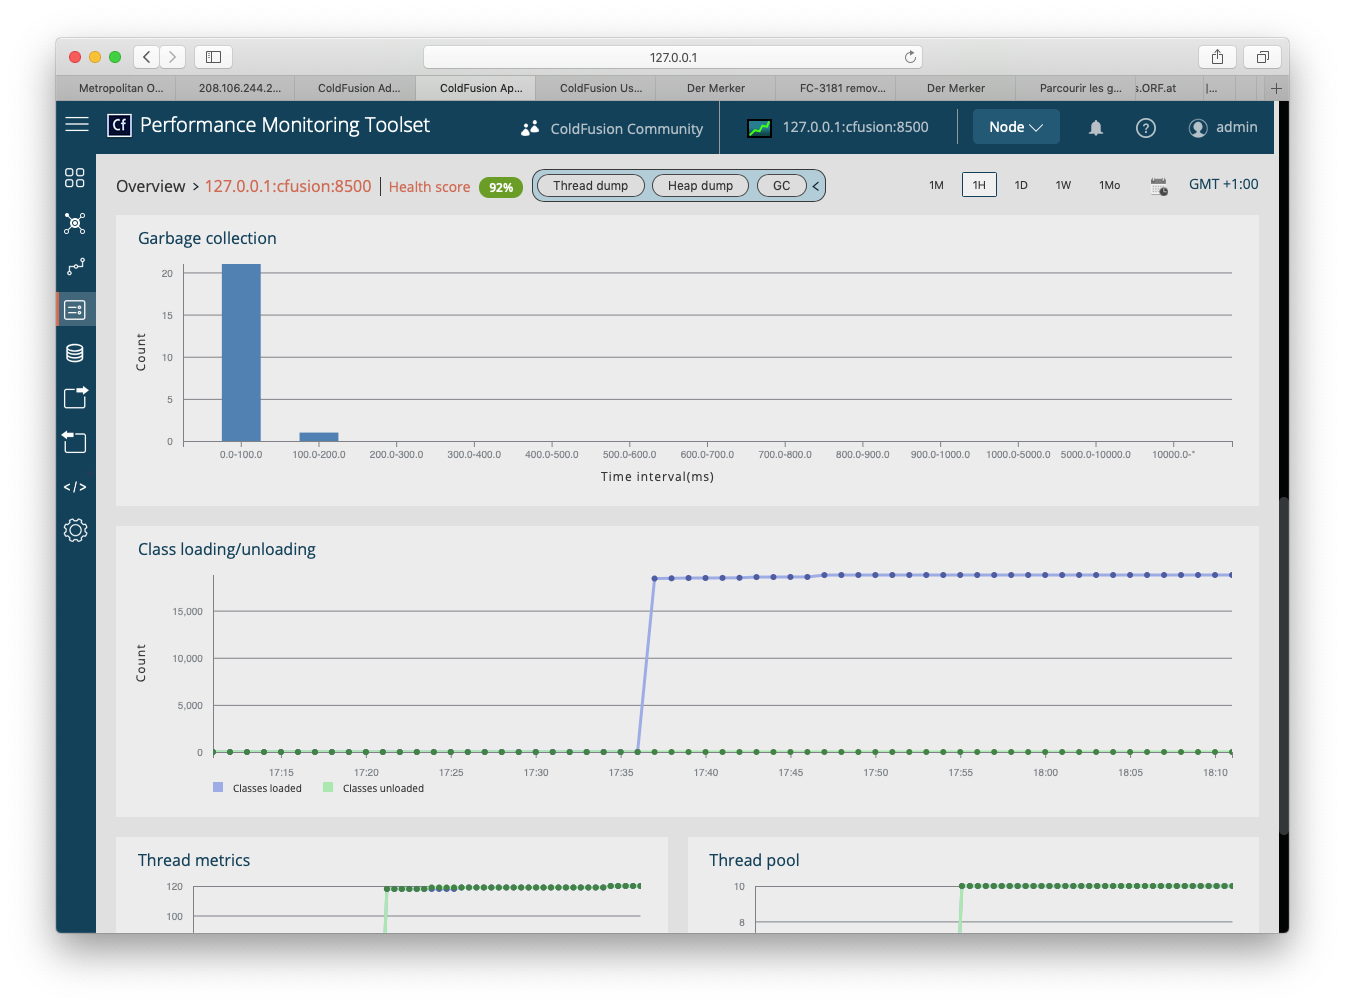
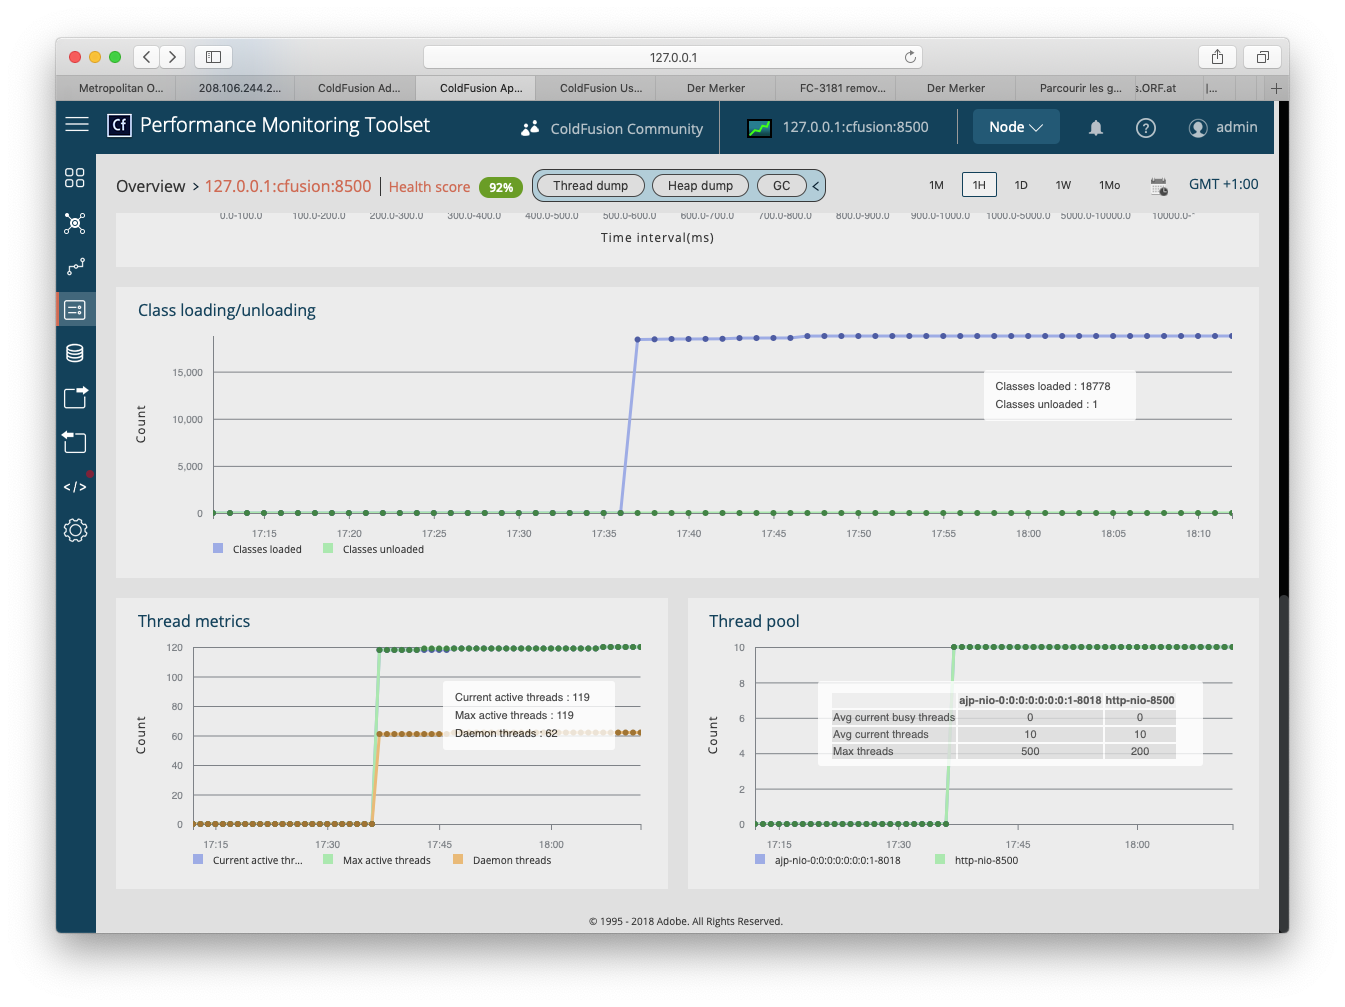
My hosting provider informed me that my site (FarCry 7.2.9, CF11 on Windows Server 2012/AMD64 v 6.2) allocates too much memory. (They claim more than 1 GB.) Having looked up the object broker settings in the FarCry backend admin section, I could not find anything out of the ordinary. It is a small site with approximately 20 dmHTML items, 400 dmNews items and, currently, 500 dmImage items. Each of the dmImage items contains three versions of images with an average total size of 300 kB per content object.

Usually, people don’t scan the entire site – which could bring the cached objects to the FarCry preconfigured limits of 1000 instances per object type – but are only interested in the latest news/articles. Also, I don’t use the friendly URl function.

I use the skin:cache feature on all dmNews and dmHTML pages with the command shown below and a caching time of 14 or 1 day(s) respectively:
<skin:cache cacheBlockName=“page”
cacheName="_#stObj.objectID#_displayPageStandard"
days="#application.config.general.ttl.pageGeneral#">

Has anybody experienced anything similar? Do I overlook anything? Is it possible that bots and crawlers which parse the entire site will fill the object broker cache in the application scope?

And, more important: Which actions can I take to bring down the memory footprint significantly in order to avoid the site being shut down?

Any suggestions are greatly appreciated.

Thank you,
Thomas

Have they mentioned the method they used to measure the memory usage of your application? In my experience doing that with one JVM and multiple apps is difficult, and depending on the method used you can get wildly varying results. If you know what and how they are measuring then maybe it’ll be easier for you to do those same measurements yourself so that you can know that you are making improvements as you go.

If you were able to be isolated in your own ColdFusion instance you could limit the memory allocated to the JVM to 256MB and your site would probably run quite happily. If the host is able to do that (probably requires CF Enterprise) then that might be an option.

Just some observations on what you’ve described;

  • For object caching, 20 dmHTML + 400 dmNews + 500 dmImage records would be lucky to consume 25MB RAM (based on 50kb per dmHTML/dmNews record and 5kb per dmImage record)
  • Object caching is literally the struct representation of a row in the DB (plus any associated arrays), wrapped in another struct that has some info about the object and some timestamps. The overhead is minimal.
    -The binary images are not stored in the cached dmImage objects, they only contain paths to file storage.
  • You could review your use of skin:cache, in general we try to move away from that tag and rely on the “webskin decorators” to set the cache status and cache timeout of webskins as a whole. You should only caching things that are slow, such as certain webskins that have DB queries, or external calls to things like APIs, or large amounts of disk access. If a page is already very fast (say, sub 50ms) there is no need to cache that HTML output.
  • Cached HTML, if you have it enabled for all pages in your site, is likely to amount to much more than the size of the object broker cache. If you had to remove anything I’d start there.
  • Shortening the HTML caches to mere minutes instead of days might help in bringing the memory usage down a little
  • Using an external cache server is the “easiest” way to get object broker and webskin cache data out of the JVM memory, but that might not be feasible in your hosting environment. We have plugins for Memcached and Redis (Memcached should support FarCry Core 6.2, Redis probably requires 7.x).
  • If you make heavy use of sessions then you could review that. Try not to store anything custom in the session if possible. FarCry Core does track a few small structs in the session but I’d guess they are smaller than 5kb per session.
  • FarCry supports reverse proxy caching, meaning if you use something like Cloudflare in front of your site, you can use the proxycachetimeout webskin decorator to provide the s-maxage header in the reponse, and Cloudflare will use that to serve up a cached copy of the page without having to hit the backend server. This is super fast, but of course only works on pages where it doesn’t rely on a user session, or doesn’t include forms (these two things can be cachable but may require some code changes to do some things differently, so it greatly depends on how your app works).

So I guess the short version is; start with getting more info about how the measurements are taken, repeat it yourself to confirm, and then try reducing the caching and session usage as a start and measure again to see if you can spot any improvement.

I hope that at least gives you some pointers to work with :slight_smile:

cheers,
Justin

1 Like

Thank you for your comprehensive reply. Some thoughts while the hosting company’s response is pending:

  • I will look into the use of the skin:cache tag since it seems to store the cache information in both the server and the application scope. (I wonder why this is the case.)

  • The site does not use any explicit caching meta tags for HTML caches. I chose to rely on FarCry doing the job. And it does it well, bringing the response time down from an (uncached) 12 s to a mere 110 ms. [My guess for the long “uncached” response time is that the hosting company runs too many instances on one physical server.] But I might try a “no-cache” meta tag to force everything on FarCry.

  • As a first measure, I limited the cache TTL to one day. After 16 hours of uninterrupted application uptime, the FarCry backend object broker reports 240 dmNews items to be cached. And 12 dmHTML items. To me, that’s a feasible amount – and a long way to go until 1 GB of memory will be reached.

  • Since the site doesn’t run any personalized content (avoiding all that GDPR work and monitoring which comes with it), I don’t see any room for improvement there either.

  • Can you comment on the behavior of the Java classes FarCry loads? Is it possible that one (or multiple) may come with a memory leak, thus slowly but steadily filling the memory?

As of now, I can only wait for the hosting company’s response.

Thanks,
Thomas

Justin,

I installed the CF 2018 Performance Monitor Toolset (PMT) on my test box (macOS 10.14.6, CF 2018/update 10) and started the site (running FarCry CMS 7.2.9 with a few trunk tweaks from August 2019).

The result is somewhat disillusioning: Although I only use FarCry base code with the skin:cache feature enabled – no fancy application code, processes, etc. --, the PMT reports for the Java Virtual Machine (JVM) a committed heap space of 707 MB and a maximum (allotted) 911 MB. The used heap space oscillates between 465 and 570 MB, no matter if requests are being made or not. (The memory range on the server is between 256 MB and 1024 MB.)
CF2018-PMT-20200817

When the FarCry CMS application starts, the PMT reports more than 18300 classes to be loaded.

That is a lot more than the 256 MB you mentioned and certainly not a consumption one would like to see in a shered hosting environment.

Any ideas how I can get this number down?

Thanks,
Thomas

Hey Thomas,

When you are looking at the memory used by the JVM, that includes the memory used for running Tomcat + ColdFusion + any other processes that are running which includes the Performance Monitor itself. All of these things use resources/memory inside the various memory spaces in the JVM before you even have an application running.

The total heap memory used in your case, going between 465-570MB (let’s call this total “MT”), is all of the previous things I mentioned (Tomcat, ColdFusion, Performance Monitor, let’s call this “M1”), plus any memory used by your application (let’s call this “M2”);

So, if MT = M1 + M2, and you want to know the value of M2, you’d need to find the value for M1 and subtract it from the total MT; M2 = MT - M1. This is a very rough way of doing things but it should give you a figure that’s at least in the ball park of what you want.

To verify this, you can start a ColdFusion application which just has an index.cfm that prints “Hello world” and does nothing else, and then when you look at Performance Monitor you’ll probably see a somewhat similar baseline of memory allocation and heap memory fluctuating as you monitor it with Performance Monitor.

Let’s just pick a number out of thin air as an example and guess that the heap usage for M1, which is effectively no running “application”, just Tomcat, ColdFusion and the performance monitor, is around 250-350MB (M1 = 250 to 350). Subtracting that from the totals might might mean that your application is using somewhere around 200MB of heap on average (M2 = 450 - 250 = 200).

(Side Note: The JVM uses garbage collected memory allocation. What a healthy app should do is use heap memory as it needs to and then when the JVM does a garbage collection the allocated memory that is no longer in use should be freed. The up and down zigzag on the blue line in the graph you posted is exactly what a healthy functioning heap in the JVM should look like; heap usage increases, memory is garbage collected and the used heap drops, rinse and repeat over and over.)

A couple of followup questions that might give us clarity;

  1. Do you know if the method you’ve used (Performance Monitor) is how the host is measuring it? How are they isolating the memory used by your application from all the other applications on the same shared host (and from Tomcat, ColdFusion, and other services running inside the same JVM)?

  2. Does the “Applications” tab in your screenshot show any further useful info? (I haven’t used that feature myself and don’t have CF2018 installed currently to test).

cheers,
Justin

Hi Justin,

Thank you for your reply.

I will have to check and will provide you with a screen shot of the entire JVM section.

The CF PMT seems to be a pretty bold tool to learn more about your CF applications. As always with Adobe, you need to try a couple of times before you understand what‘s going on (for example, the name of your server), but — whatever. The PMT distinguishes between your applications, meaning that the CF administration is listed in its own section and can be monitored, too.

I‘ll keep you posted.

Thanks,

Thomas

Hi Justin,

I am sorry for the delay, but please finde below three screen shots of the JVM details from the CF 2018 Performance Monitoring Toolset. A FarCry application seems to require approximately 450 MB of heap space, no matter of requests are processed or not.


This application uses the skin:cache tags on each dmNews and dmHTML page, caches the pages for a day and restarts the application every second day.

I cannot see anything wrong here but would like to learn about others’ experiences with respect to those figures.

That looks like the heap of the entire JVM might be using 450MB. Can you click on “Applications” to see the memory usage of your app in isolation?

There is not much to see here. The “Applications” does not show any memory usage:


The lower part of this section only shows the site errors (4xx and 5xx).

What’s interesting, though, is that suddenly the memory usage drops, now oscillating between 160 and 260 MB, independent of the number of requests being made. (I guess this is in the memory range you expected.)


Why the application/site sometimes starts up using even 650 MB or, as in yesterdays monitoring, stays at 450 MB (both oscillating), I have not the slightest idea. Since Adobe does not provide stp-by-step tutorials of how to make the best use of the PMT and I am not a (professional) System/ColdFusion admin myself, it’s a rocky path to get things working. (There is also not too much information available on the net.)

My guess is that the amount of memory the site really uses is the lowest number. But I can also live with 500 MBs. Everything else seems to be a hoax.

If anybody has pointers or written up something with respect of how to properly configure the CF 2018 PMT, I’d like to learn about their experiences.

The JVM heap space includes the memory used by the ColdFusion Admin, Performance Monitor, Apache Tomcat and other things are are running on the server, so your FarCry application is not responsible for the entire 650 MB of heap space used, some of that can be attributed to the other things running in the JVM.

150-250 MB RAM sounds about right for a normal FarCry website. With Lucee we can set the JVM total allocated memory to 256 MB or less and a website will run totally fine (so within that 256 MB fits Tomcat, Lucee and the FarCry app). Similarly, if you give the JVM 2 GB RAM then it will “use” it even though in reality it’s not actively using all of that memory concurrently, it’s effectively got some things in memory that are no longer in use but might not have been garbage collected yet. So the JVM will “use” more memory when it’s available, and then garbage collect it when it needs to; this is the way memory allocation/usage in the JVM is designed/expected to work.

If the PMT doesn’t show memory used per Application then it’s fairly difficult to know what the memory is being used by. Did your host tell you how they are measuring your applications memory usage? We’d need to know what method they are using to measure so that we could do the same thing.

I am sorry for the delayed answer. On my development system, I have now restricted the maximum JVM heap size (hosting only one application) to 512 MB. I guess this will work just fine.

Unfortunately, the host did not tell me how they were measuring the memory usage. (They cited the fact that this would reveal data of other customers/sites.) My guess is that somebody looked at the wrong numbers and cried “fire!”.

If I happen to come across additional information, I will post it.