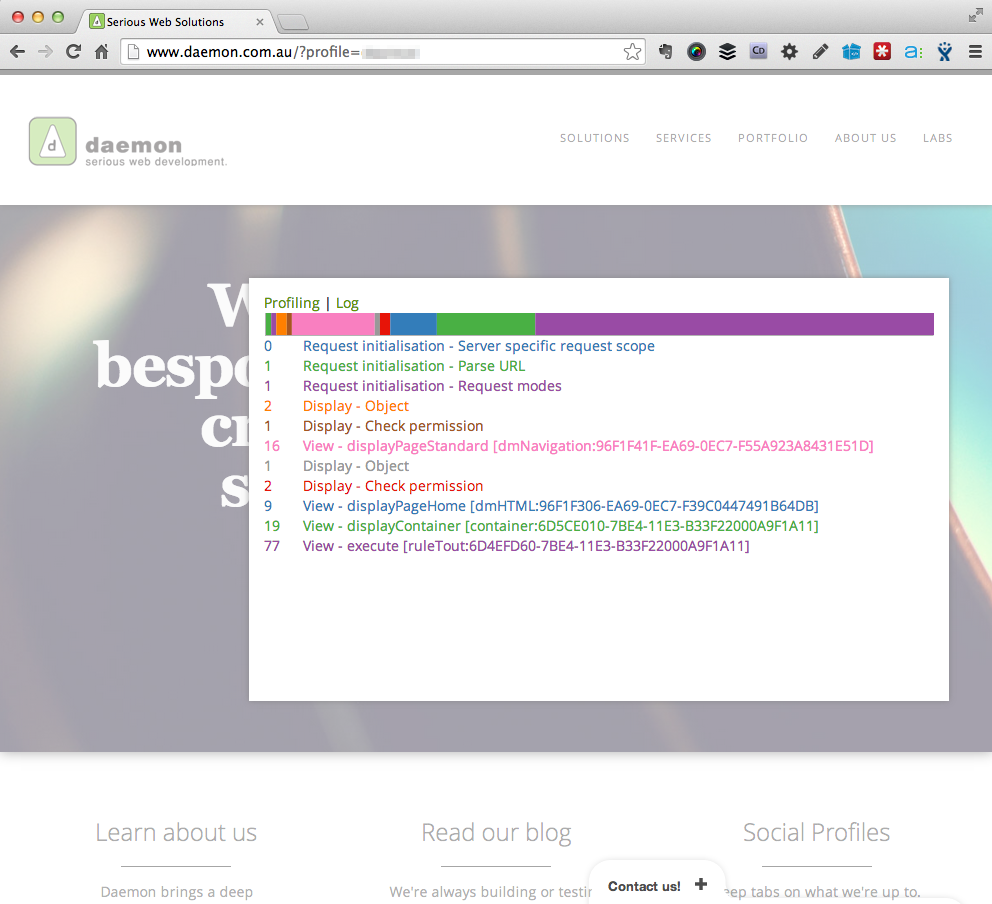
FarCry has a great little profiling tool to help you get a handle on how long various parts of your page are taking to execute. You can access the profiler from within the Contributor Tray, under the cog menu Profiler.

Alternatively, you can call the profiler up in a modal window (even when you’re not logged into the webtop) if you have your projects secret key. This is especially handy if you need to check on the health of a page in a production environment.
http://www.ubeautwebsite.com?profile=mysecretprojectkey
The coloured bar indicates the relative performance of each segment of your page’s execution. Individual times are in milliseconds.
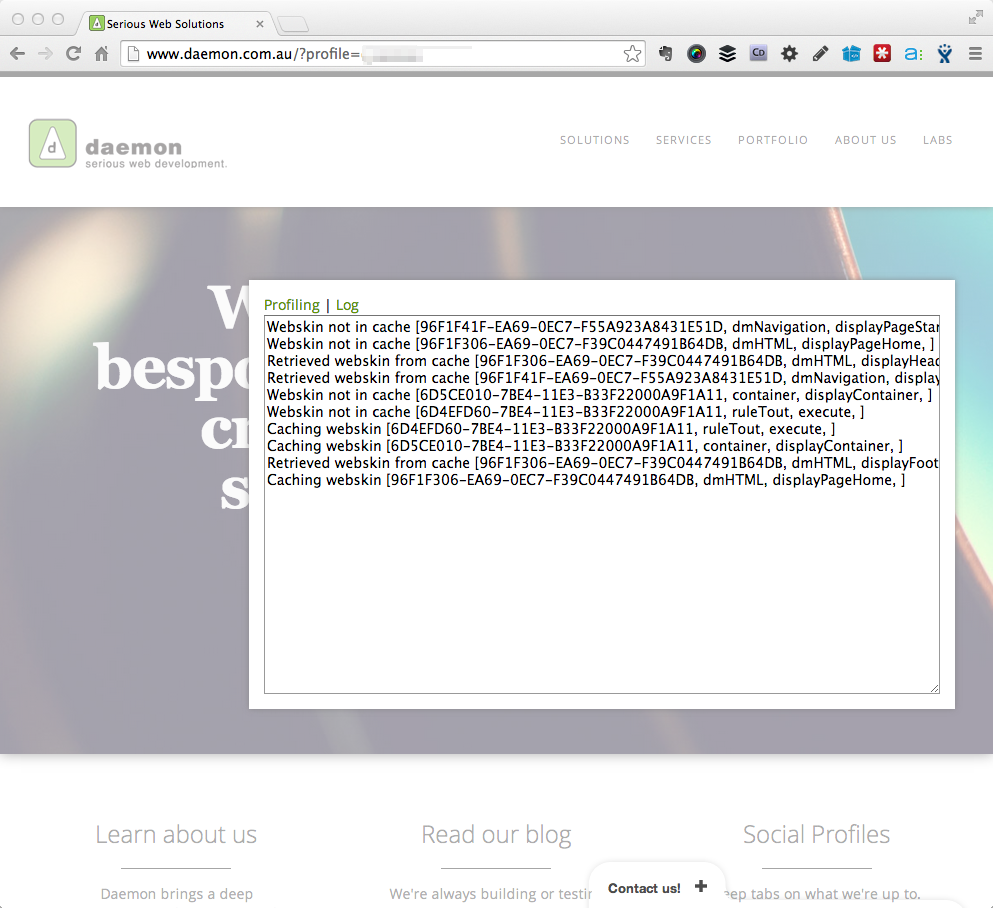
The log option gives you more information on whether or not your views are being built on the fly or coming out of the cache.
The framework profiles a series of important events by default. For example, when views are displayed, permissions checked and so on.
You can easily add your own profiling events by making a simple FAPI call in your code:
<cfset application.fapi.addRequestLog('hello world') />
Niice.